


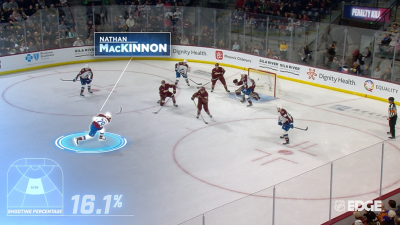
WATCH - Playbook: Connor's precise shooting powers Jets
NHL EDGE Overview
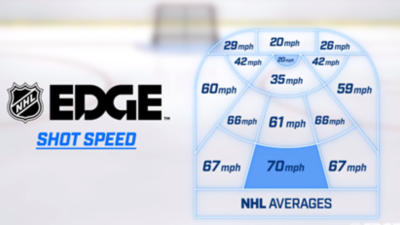
NHL EDGE Shot Speed
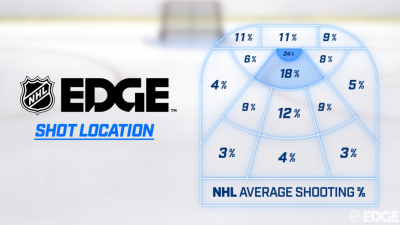
NHL EDGE Shot Location
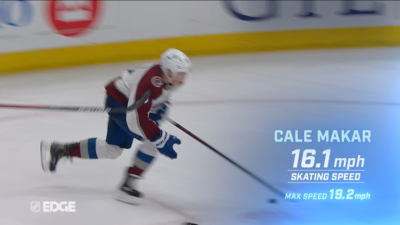
NHL EDGE Skating Speed
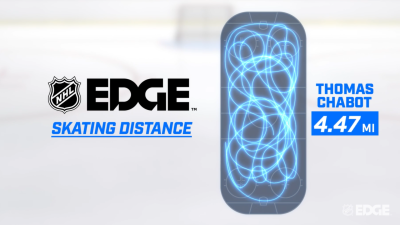
NHL EDGE Skating Distance
NHL EDGE Zone Time
Max speed measures the maximum sustained skating speed a player has achieved during the current season. Bursts measure the number of times a skater achieved a sustained speed above a given threshold. Results divided by positions groups (forwards, defensemen).


Total distance skated by an individual player during the current season while the game clock is running. Results are split by position groups, game situations, zones, top games and top periods.
The maximum speed achieved on any recorded shot attempt by an individual player during the current season. This can include goals, shots that were saved, shots that missed the net (including posts and crossbars), and shots that were blocked.
Location of the puck as of the point of release on any recorded shot on goal taken by an individual player. Shot regions were created based upon shot volume and shot accuracy and can display either shots on goal, goals, or shooting percentage. Shots and goals from beyond center red line are included in the shooter totals but not displayed in the visualization.
The percentage of time, viewable by strength, that the puck spends in each zone while the player is on the ice and the game clock is running.
Location of the puck as of the point of release on any recorded shot on goal faced by an individual goaltender. Shot regions were created based upon shot volume and shot accuracy and can display either shots against, saves, goals against, or save percentage. Shots and goals from beyond center red line are included in the goaltender totals but not displayed in the visualization.
Goals scored by a goaltender’s team while that goalie is on the ice (excludes goals scored while the team has pulled its goaltender for an extra attacker). Please note, goals scored into an empty net do not count against the goaltender that was pulled. As a result, the league average goal differential may be above zero.
Games started by a goaltender in which that goaltender recorded a save percentage greater than .900. Results are expressed in both total games and as a percentage of games played.
Max speed measures the maximum sustained skating speed achieved by any player on an individual team during the current season. Bursts measure the number of times any skater on an individual team achieved a sustained speed above a given threshold. Results divided by positions groups (forwards, defensemen).
Total distance skated by all players on an individual team during the current season while the game clock is running. Also split by position groups, game situations, zones, top games and top periods.
The maximum speed achieved on any recorded shot attempt by any player on an individual team during the current season. This can include goals, shots that were saved, shots that missed the net (including posts and crossbars), and shots that were blocked.
Location of the puck as of the point of release on any recorded shot on goal taken by any player on an individual team. Shot regions were created based upon shot volume and shot accuracy and can display either shots on goal, goals, or shooting percentage. Shots and goals from beyond center red line are included in the team totals but not displayed in the visualization.
The percentage of time, viewable by strength, that the puck spends in each zone while the game clock is running.


